Reliable infrared locomotion monitoring
Long-term cage activity monitoring you can depend on.
forrat.eu combines robust infrared measuring frames with height-adjustable sensors, sensor spacing from 2 cm and exceptionally pleasant software for acquisition, review and export.
- Sensor spacing
- 2 cm or more
- Adjustment
- height-adjustable
- Operation
- highly reliable
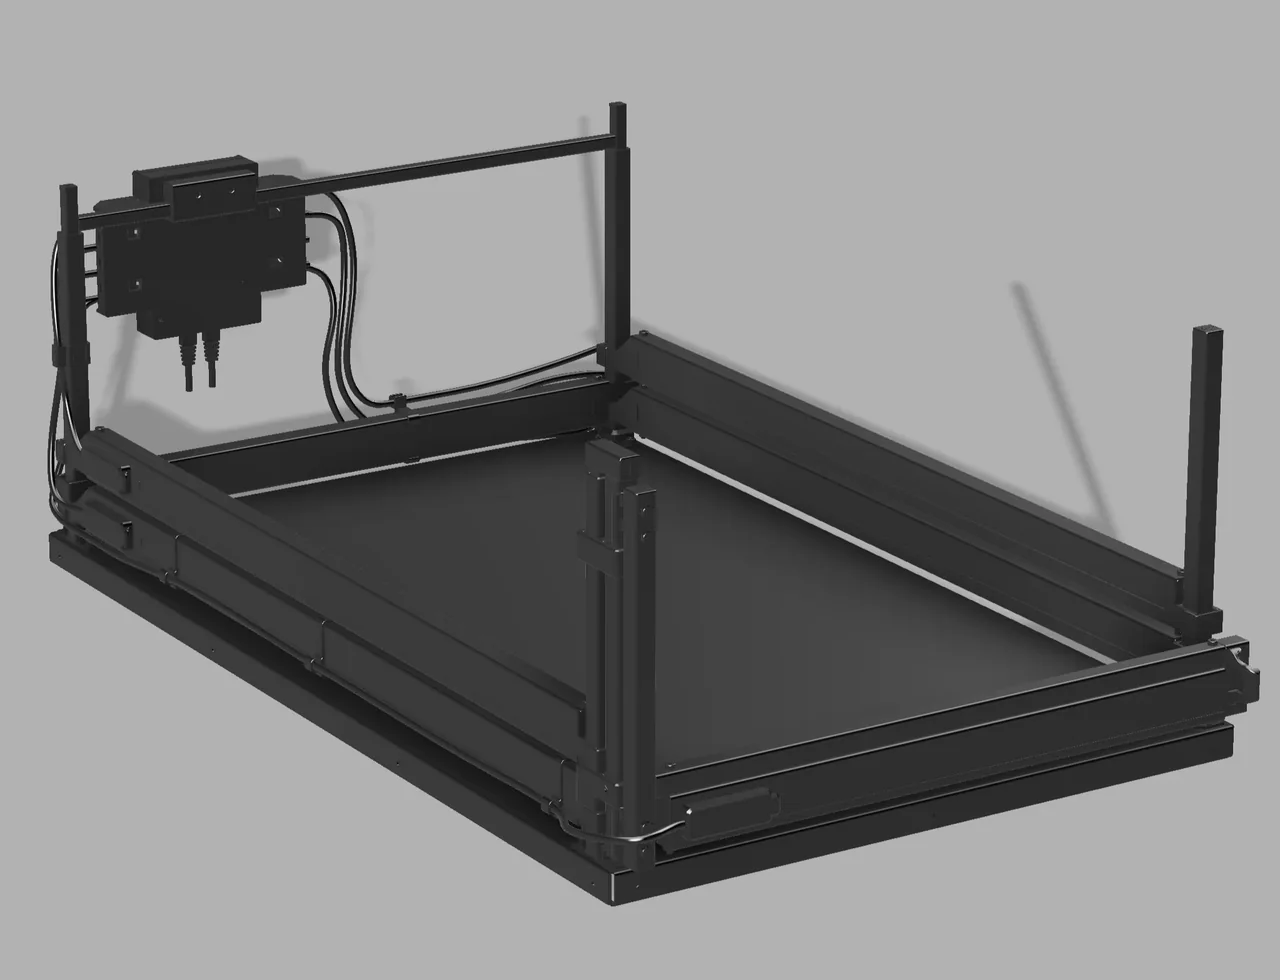
Set the measuring plane to the relevant height for the cage, animal and study instead of adapting the experiment to a fixed sensor level.
The sensors are positioned from 2 cm apart, supporting detailed monitoring across the measuring plane.
Predictable sequential scanning, paired optical paths and robust RS485 communication support stable, continuous long-term measurements.
A clear interface makes everyday acquisition, review, heatmaps, calculations and exports straightforward and comfortable.
Measurement principle
A simple measurement chain designed for dependable results.
The device evaluates direct optical paths around the cage. The 940 nm IR emitters are switched one by one in a fixed sequence, paired receivers report binary beam states and the microcontroller sends the measured stream to the server.
The uncomplicated, deterministic scanning method limits ambiguity and makes the device highly reliable during long experiments. Position, direction, aggregation, replay and exports are handled on the server, while frame firmware remains focused on stable acquisition.
Adjustable measuring height
The sensor rails can be positioned vertically so the optical plane matches the actual cage and measurement scenario.
Detailed sensor grid
Sensor spacing starts at 2 cm, providing detailed coverage of the measuring plane.
Continuous scanning
One emitter is active at a time, producing a predictable event stream that is easy to verify, process and review.
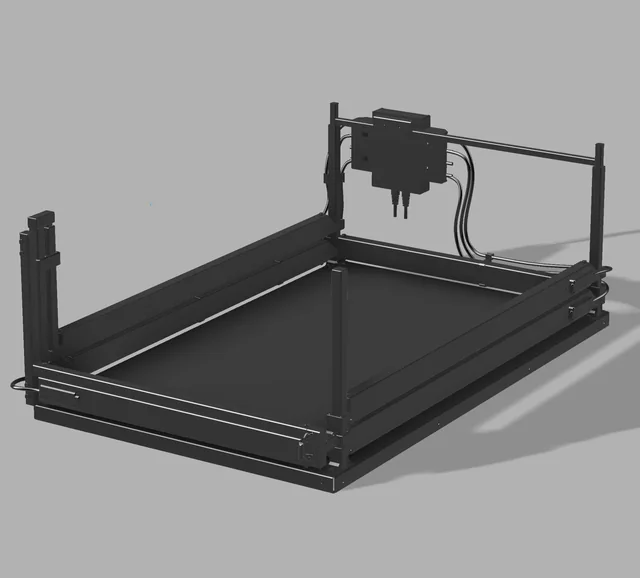
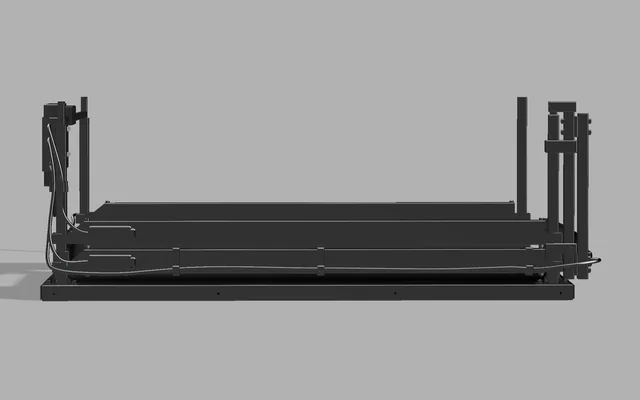
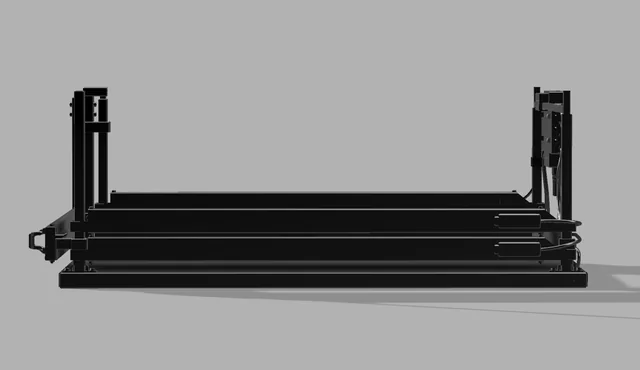
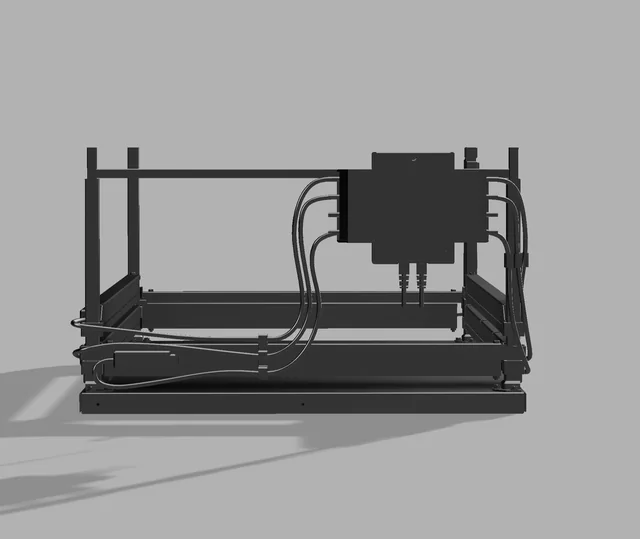
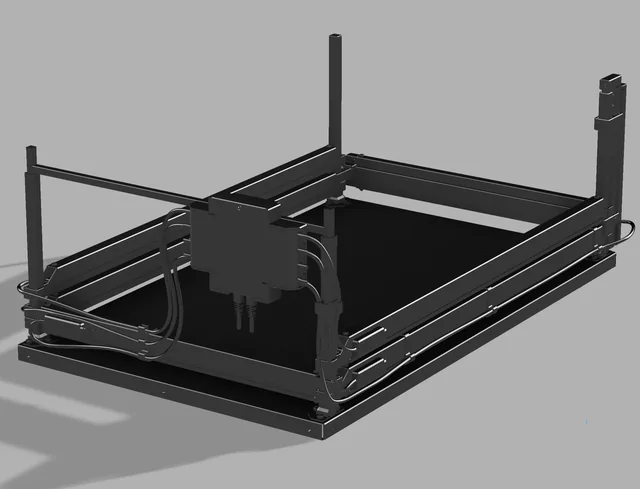
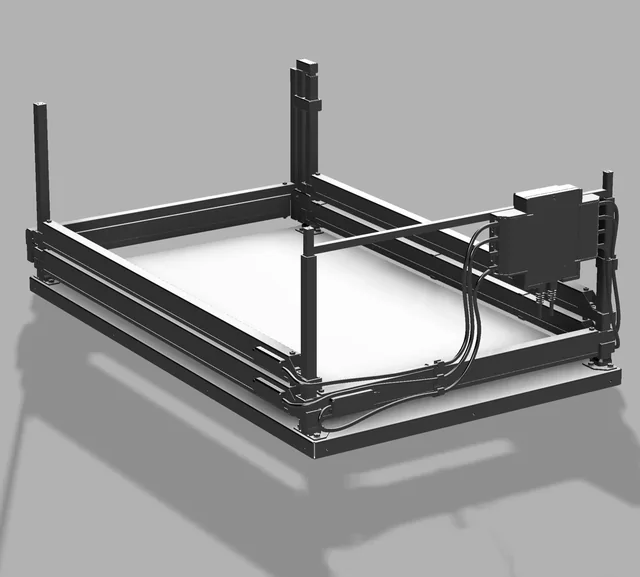
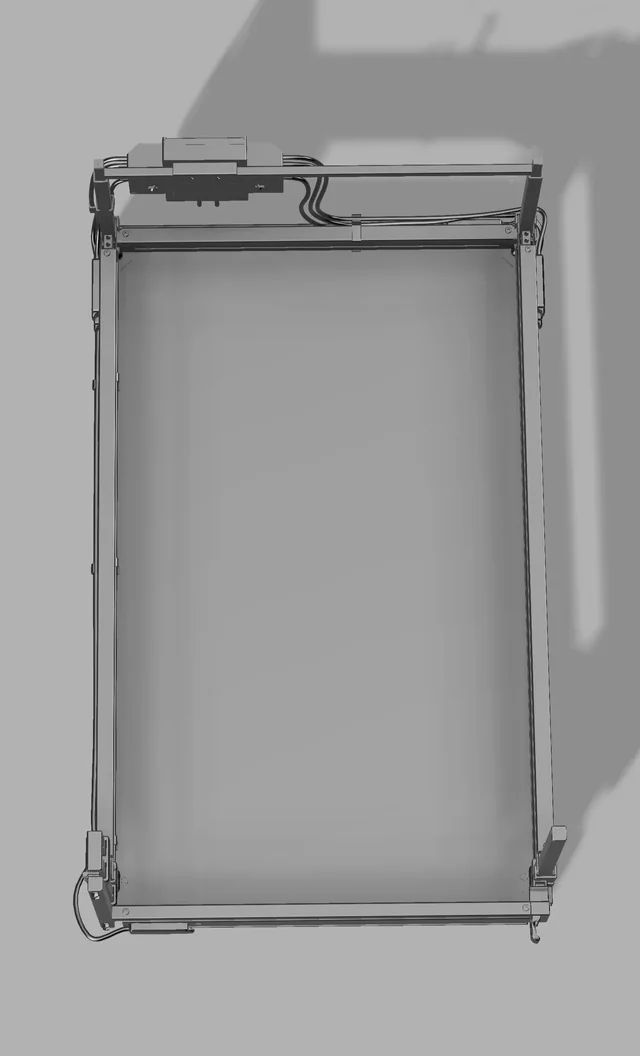
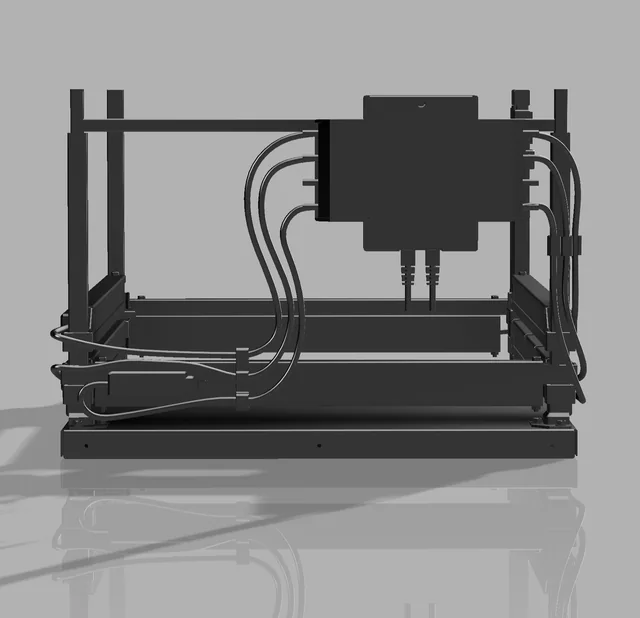
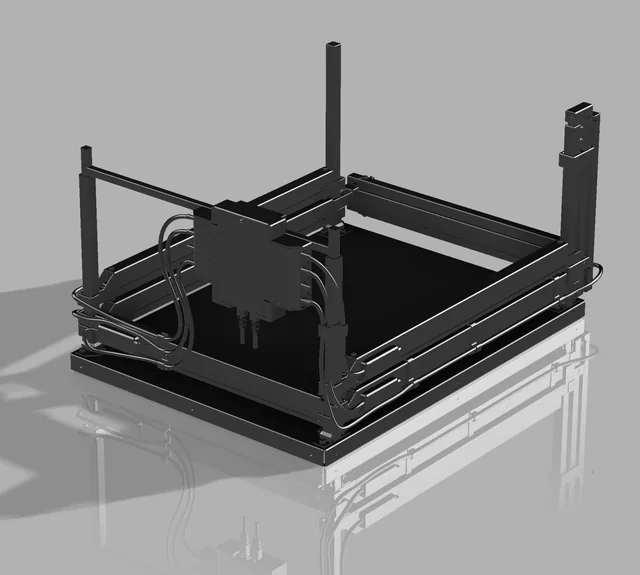
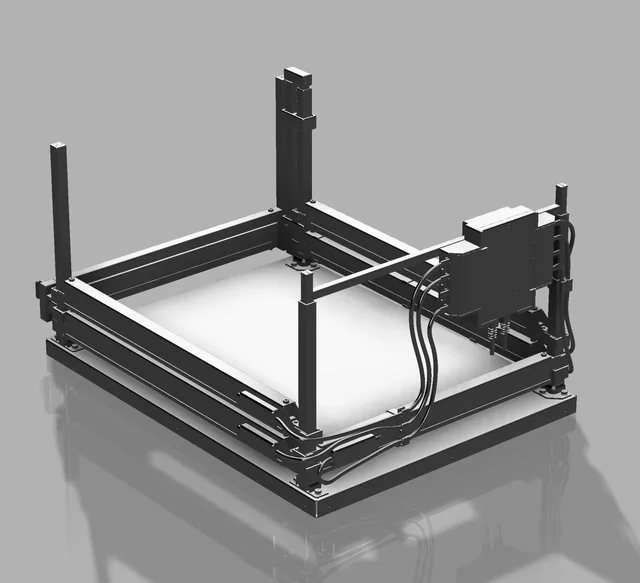
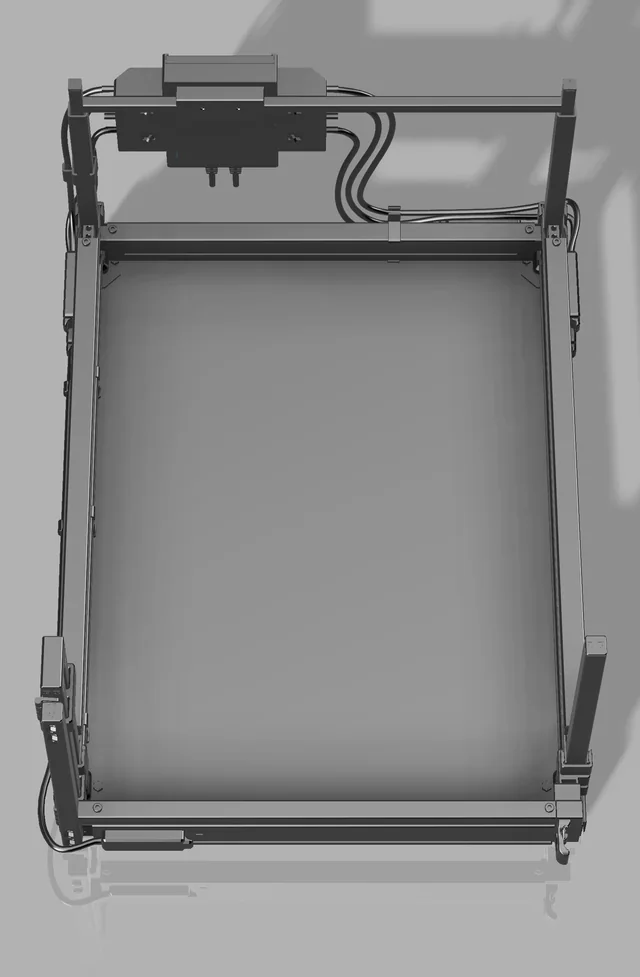
Large device
Large measuring frame for full cage coverage.
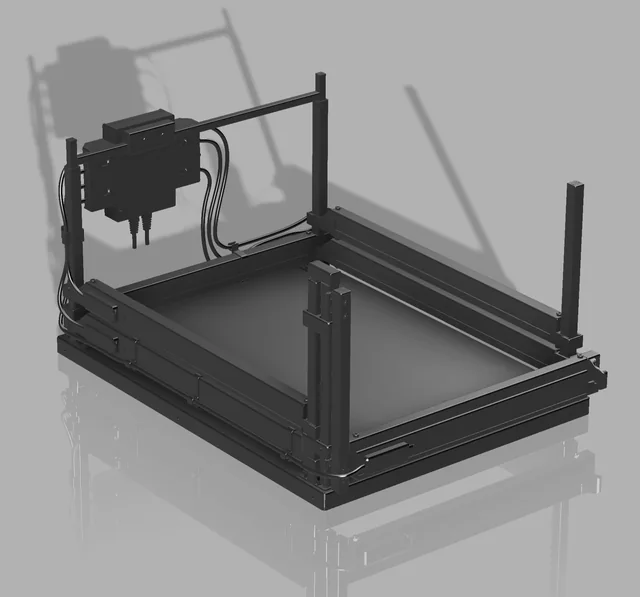
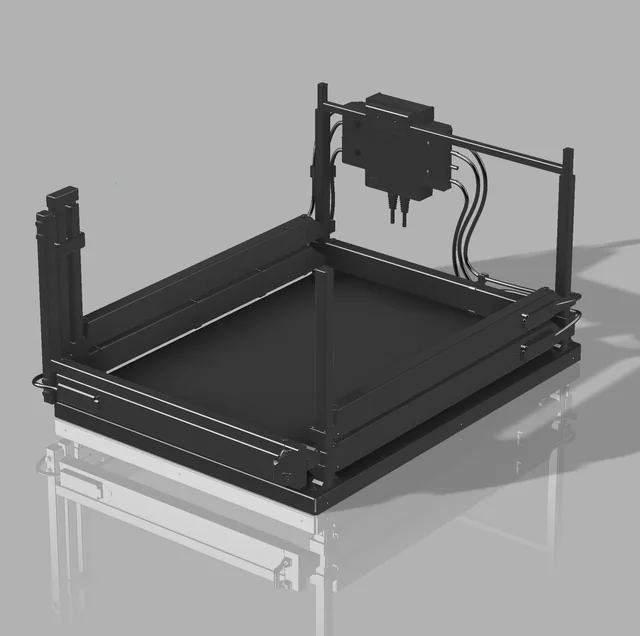
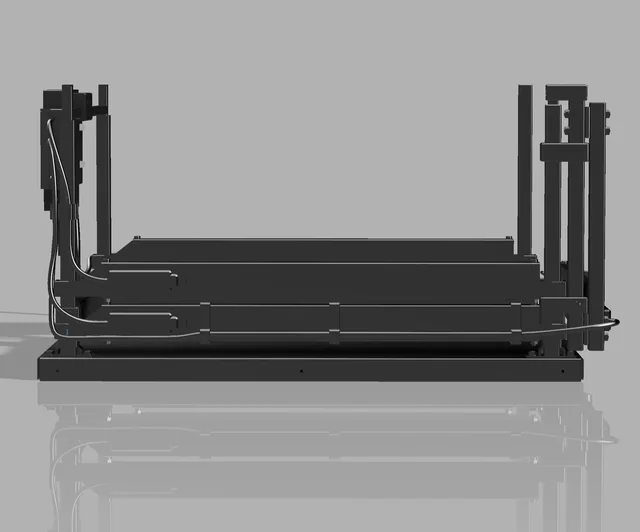
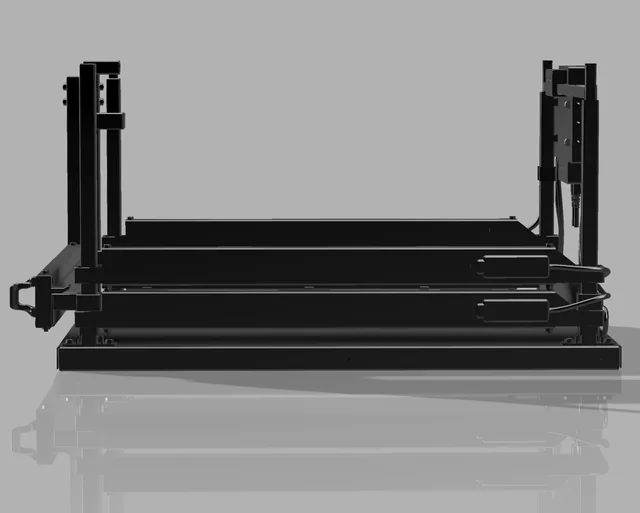
A spacious frame with adjustable sensor height and sensor spacing from 2 cm, shown from every angle. Click any image to enlarge it.
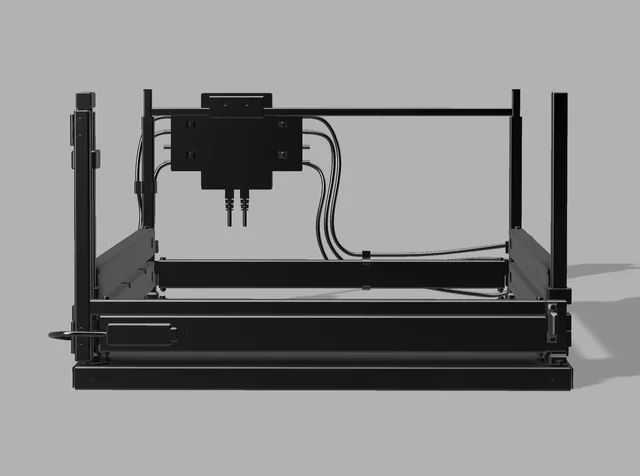
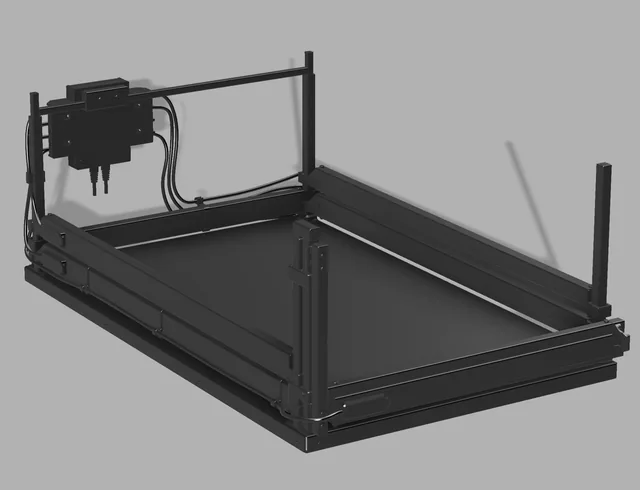
Small device
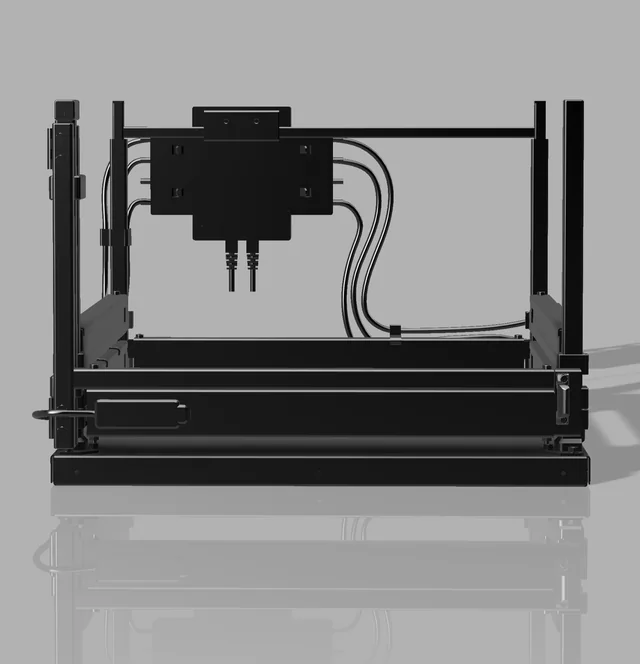
Small measuring frame for compact installations.
The same reliable measuring principle and vertical adjustment in a compact format. Click any image to enlarge it.
Reliable hardware
Modular electronics for stable, serviceable installations.
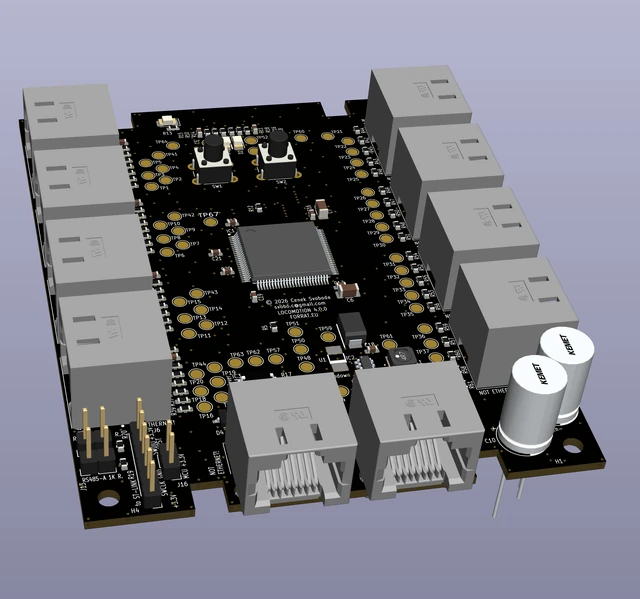
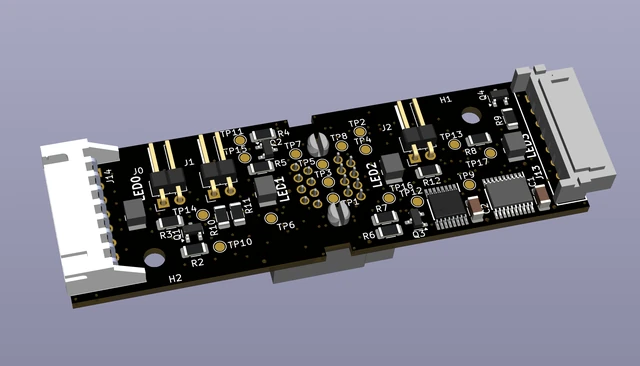
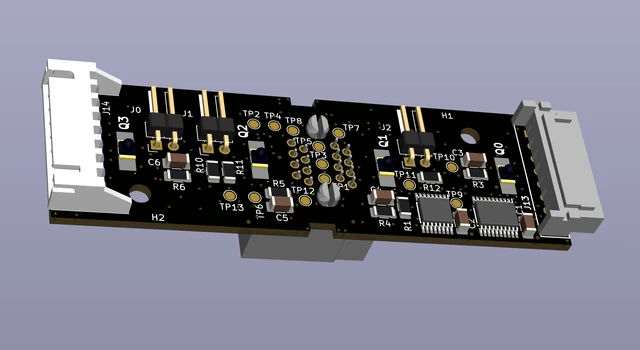
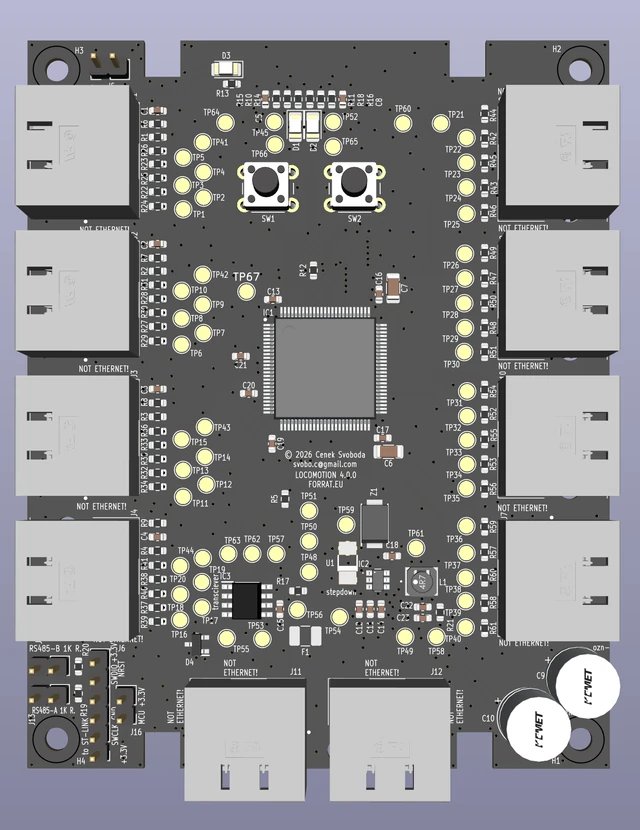
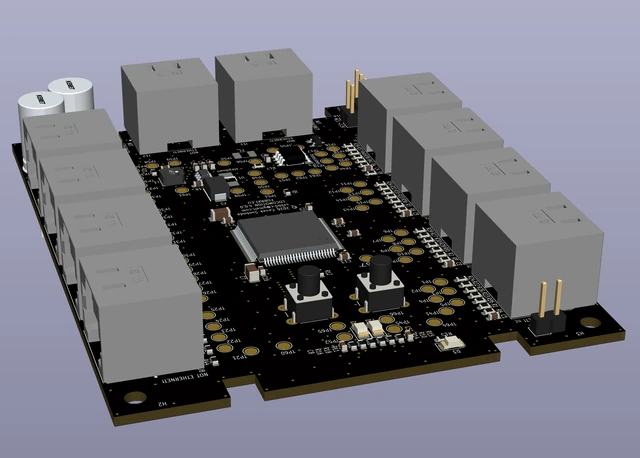
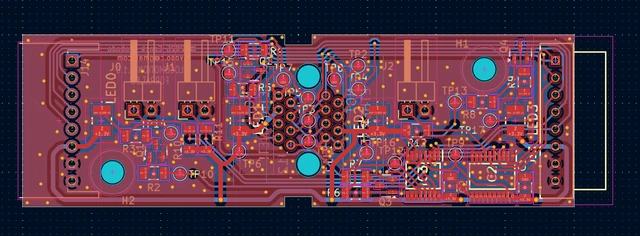
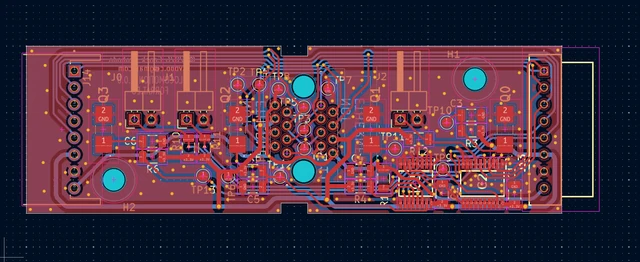
The main controller handles communication, timing and device-floor control. Separate edge boards carry the IR emitters and phototransistor receivers, making the measuring chain clear and modular.
Robust RS485 communication supports multi-device installations of up to 20 frames and separates dependable acquisition from visualization and export.
PCB views
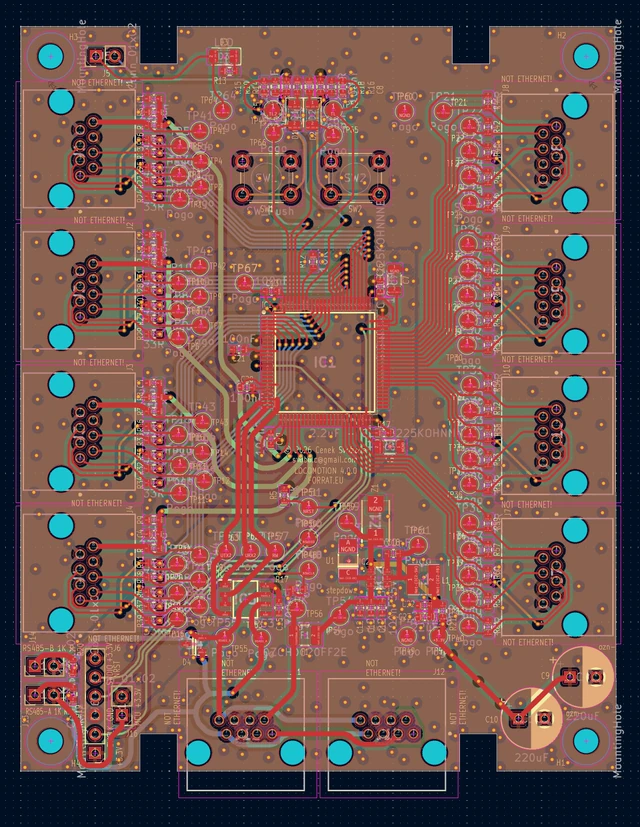
Electronics prepared for technical review.
Detailed board images support manufacturing discussion, maintenance and service documentation.
Pleasant, practical software
From live acquisition to useful results without unnecessary friction.
The server application is designed to be genuinely pleasant to use every day. A clear interface keeps live beam states, heatmaps, replay, calculations and export easy to find and easy to understand.
Researchers can review changes or interruptions, select a time range and download data without a complicated workflow. The visual flow editor combines raw channels into calculated metrics without changing frame firmware.
Immediate overview
Live states and clear heatmaps turn raw optical activity into an understandable spatial overview.
Effoless export
Select a device, date range and metric, then download the data for your laboratory workflow.
Visual calculations
Build formulas from change and interruption channels and inspect the result as a chart.
Application screens
One clear workflow from acquisition to analysis.
Explore the complete server application below. Click any screen to view it at full size.
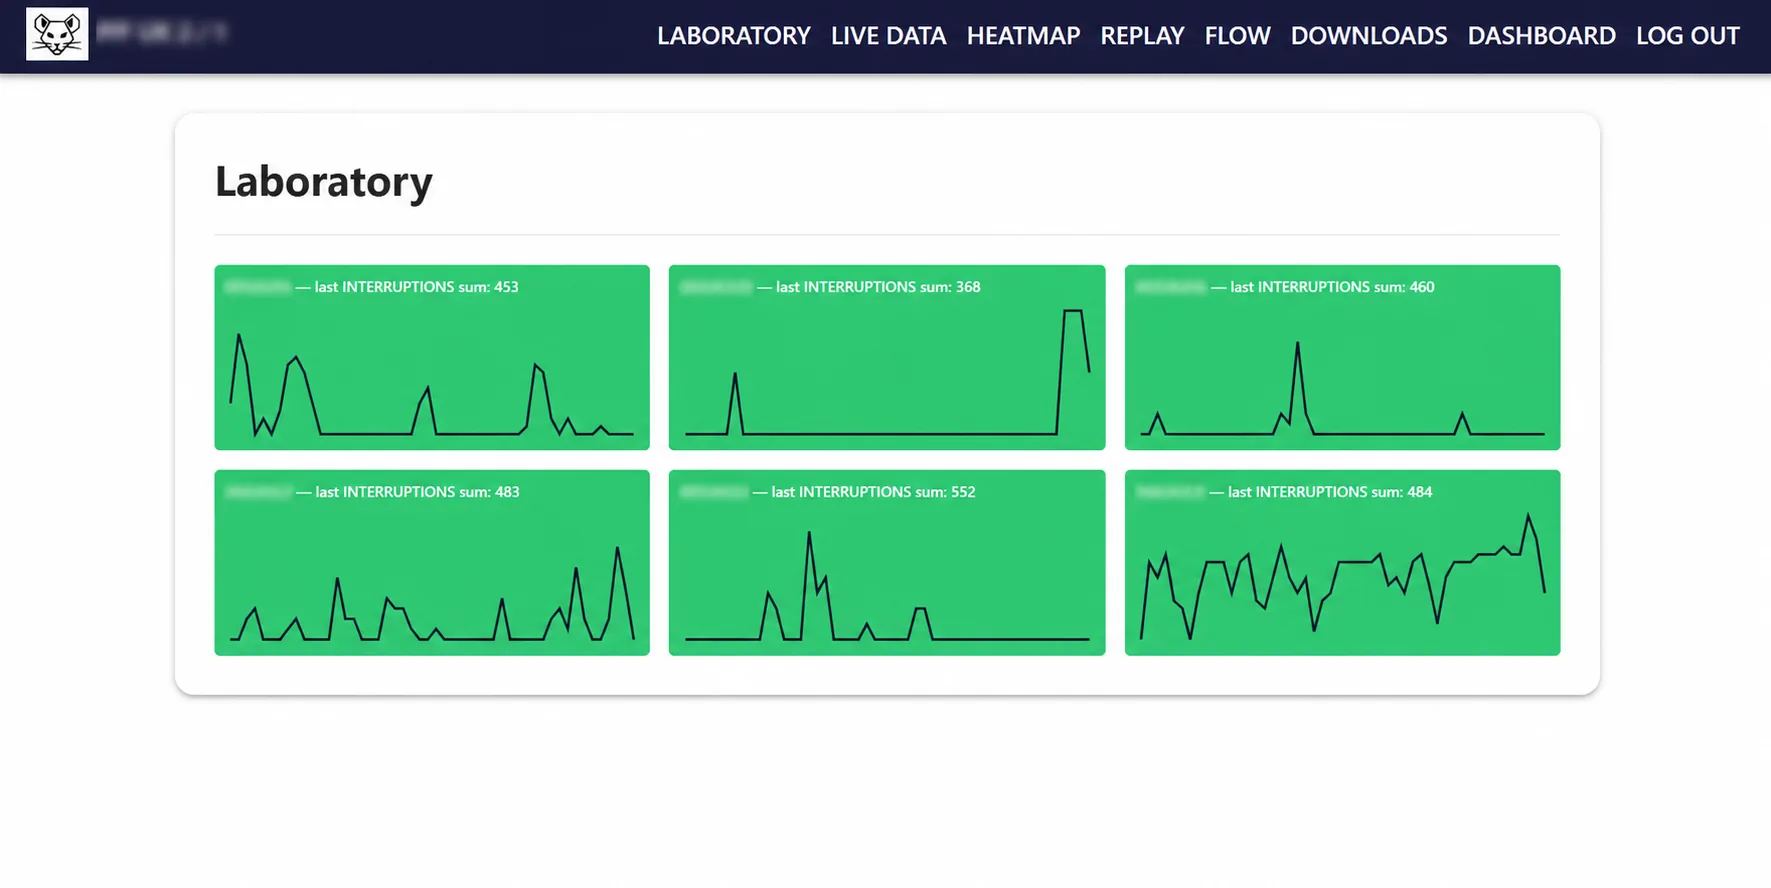
Laboratory overview
See every connected measuring frame at a glance. Compact activity charts and recent interruption totals make unusual activity easy to spot without opening devices one by one.
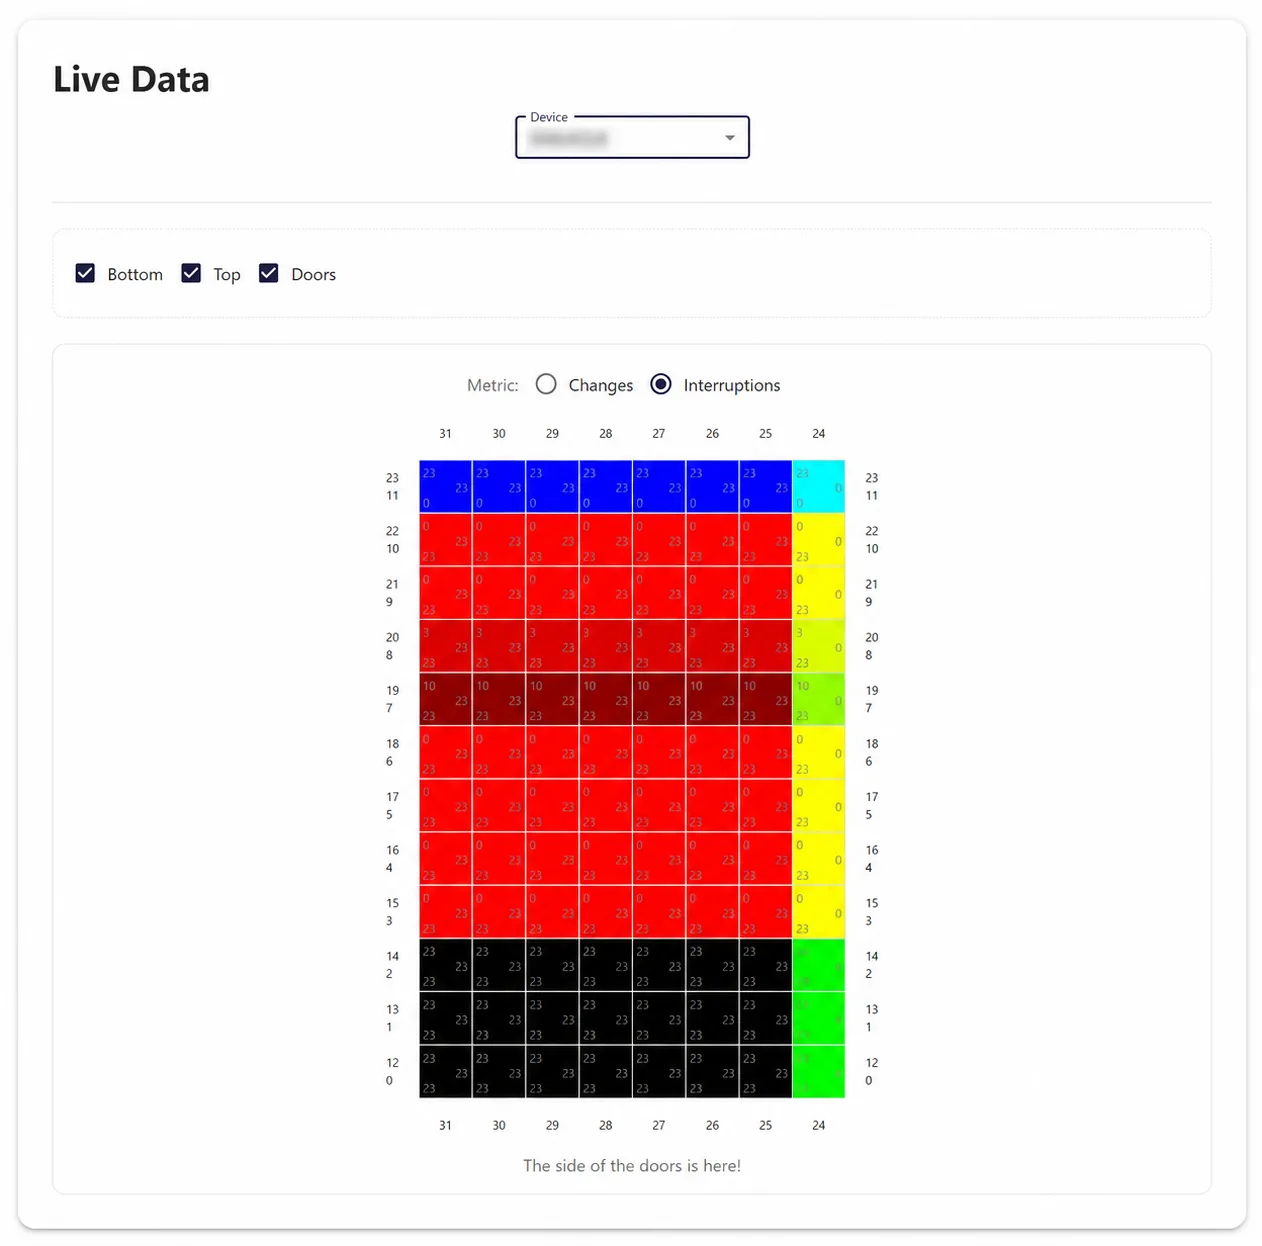
Live data
Inspect current beam states as they arrive. Switch between changes and interruptions and focus the display on the bottom level, top level or door sensors.
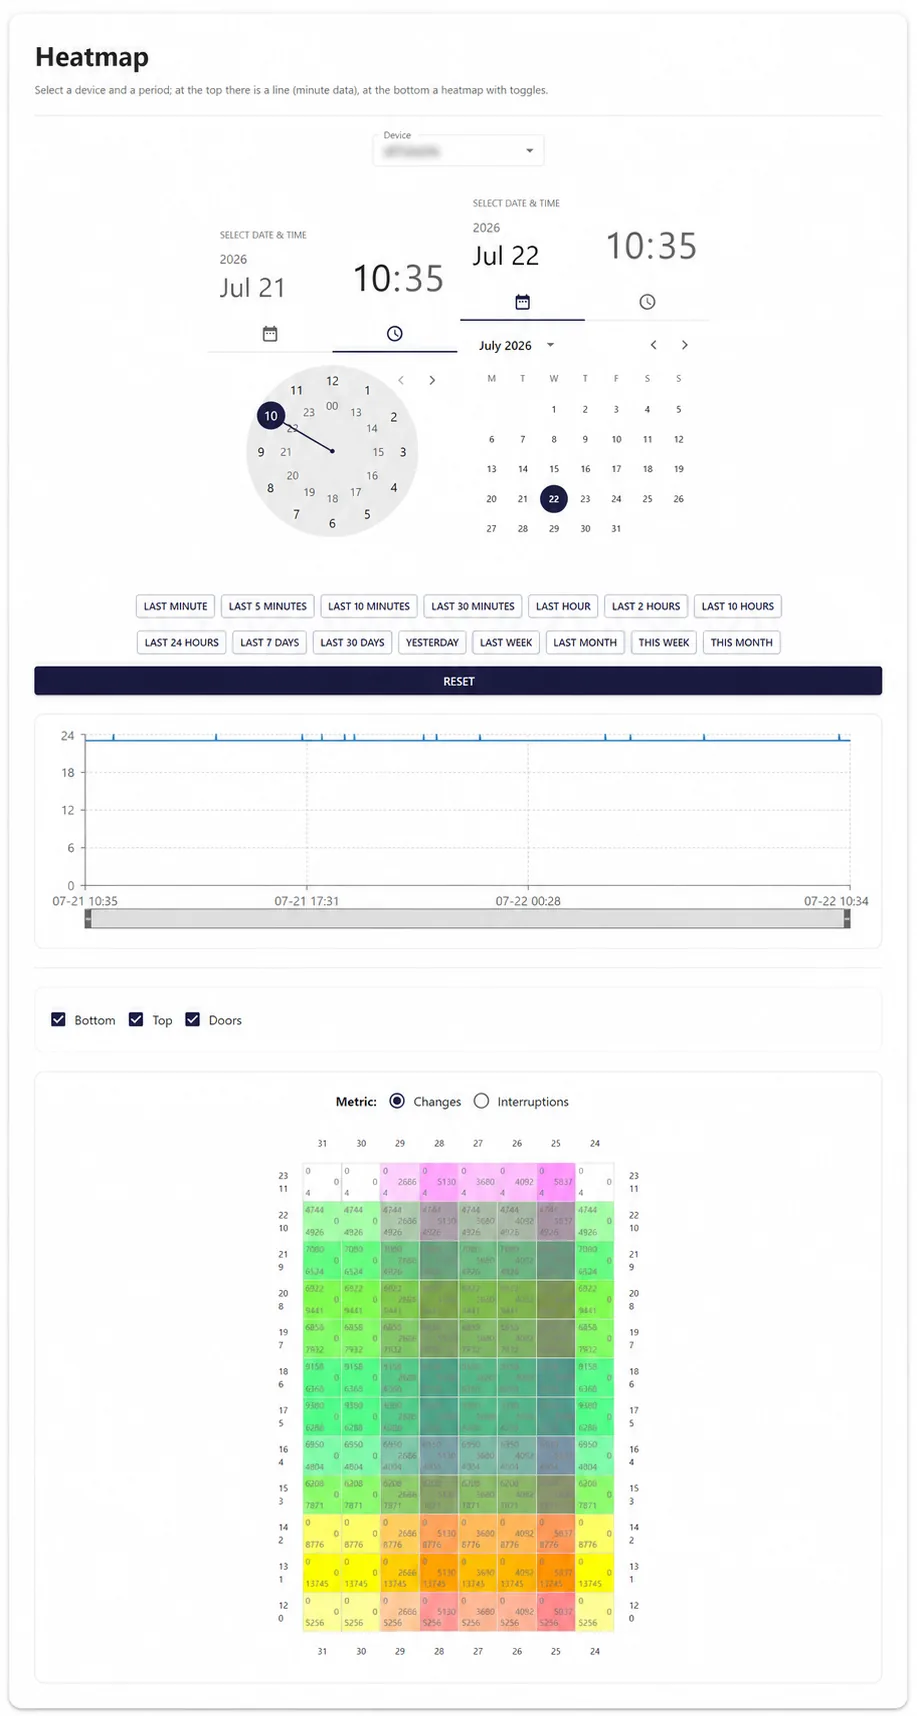
Heatmap - changes
Review how often sensor states changed across a selected period. The timeline and spatial heatmap turn long recordings into a readable overview of locomotor activity.
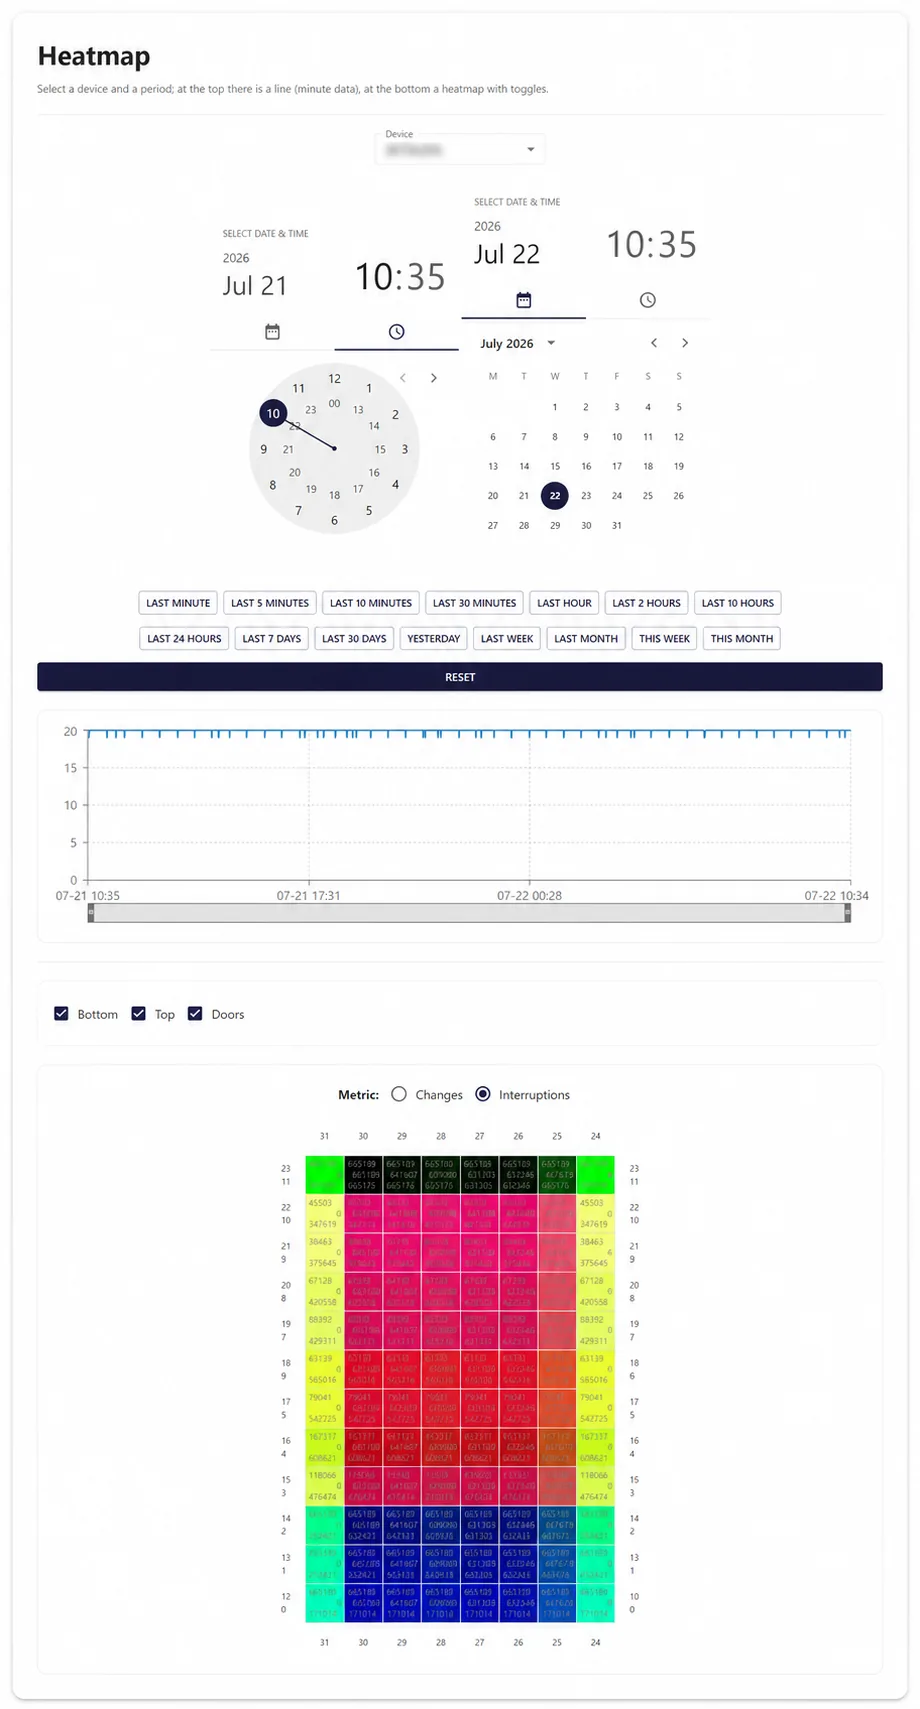
Heatmap - interruptions
Display accumulated beam interruptions by position and time range. Separate controls for cage levels and doors help researchers concentrate on the relevant part of the experiment.
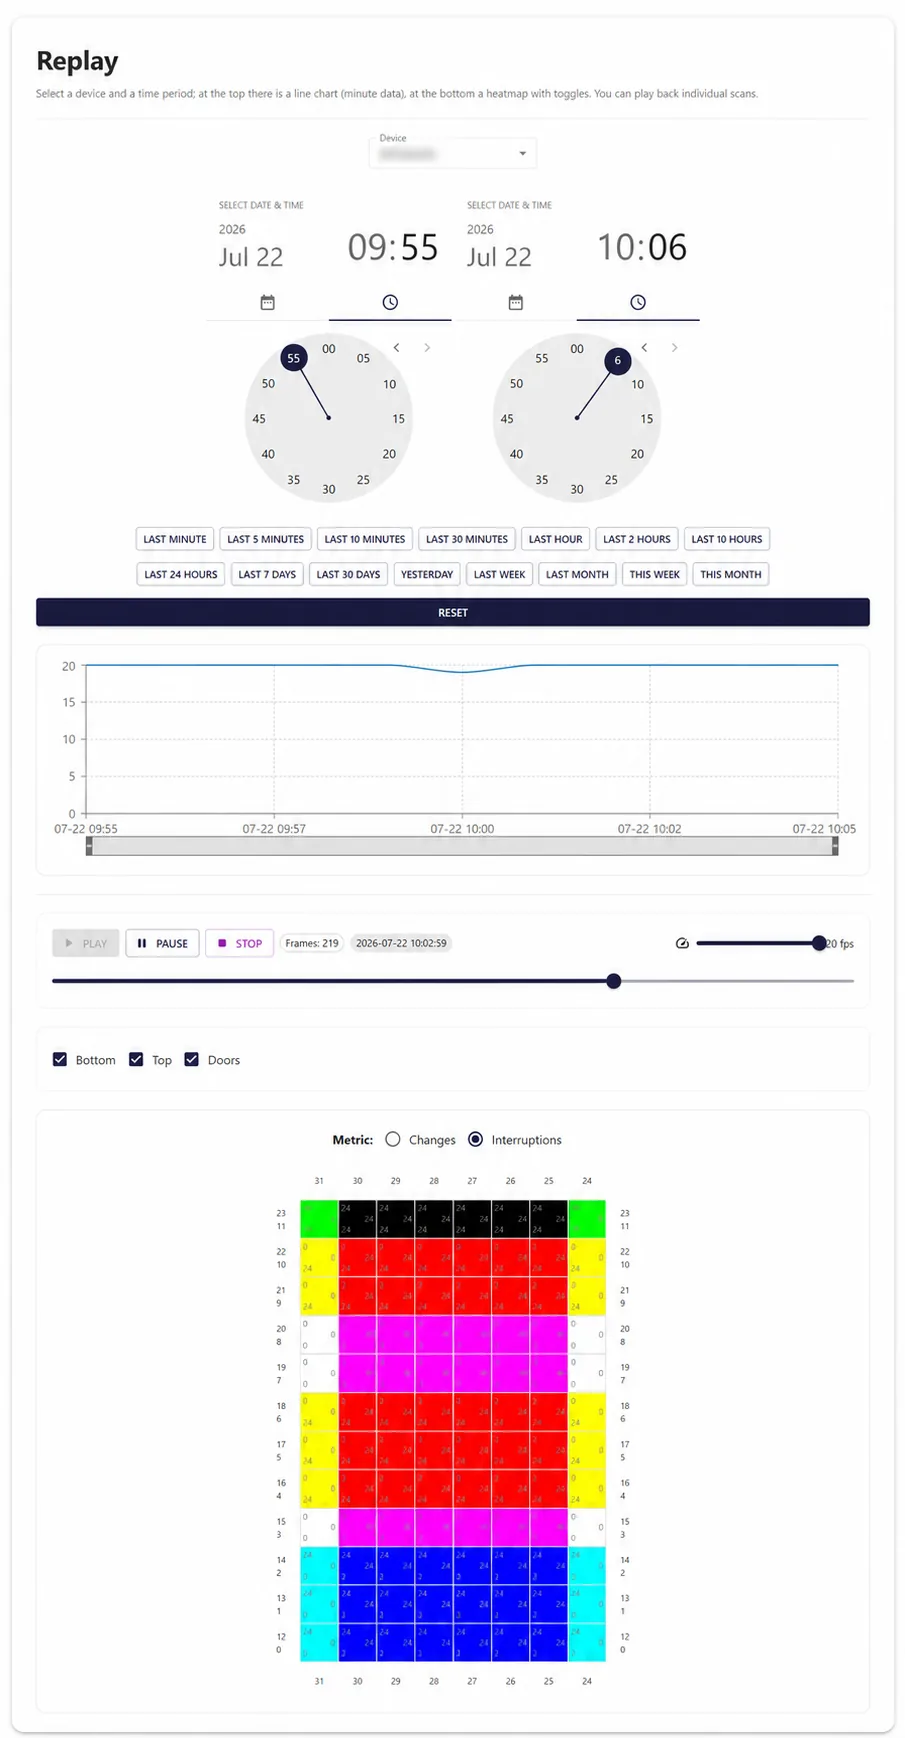
Replay recorded scans
Play an experiment back scan by scan, pause at any moment and adjust playback speed. The synchronized chart and spatial map show both the time course and the animal's position.
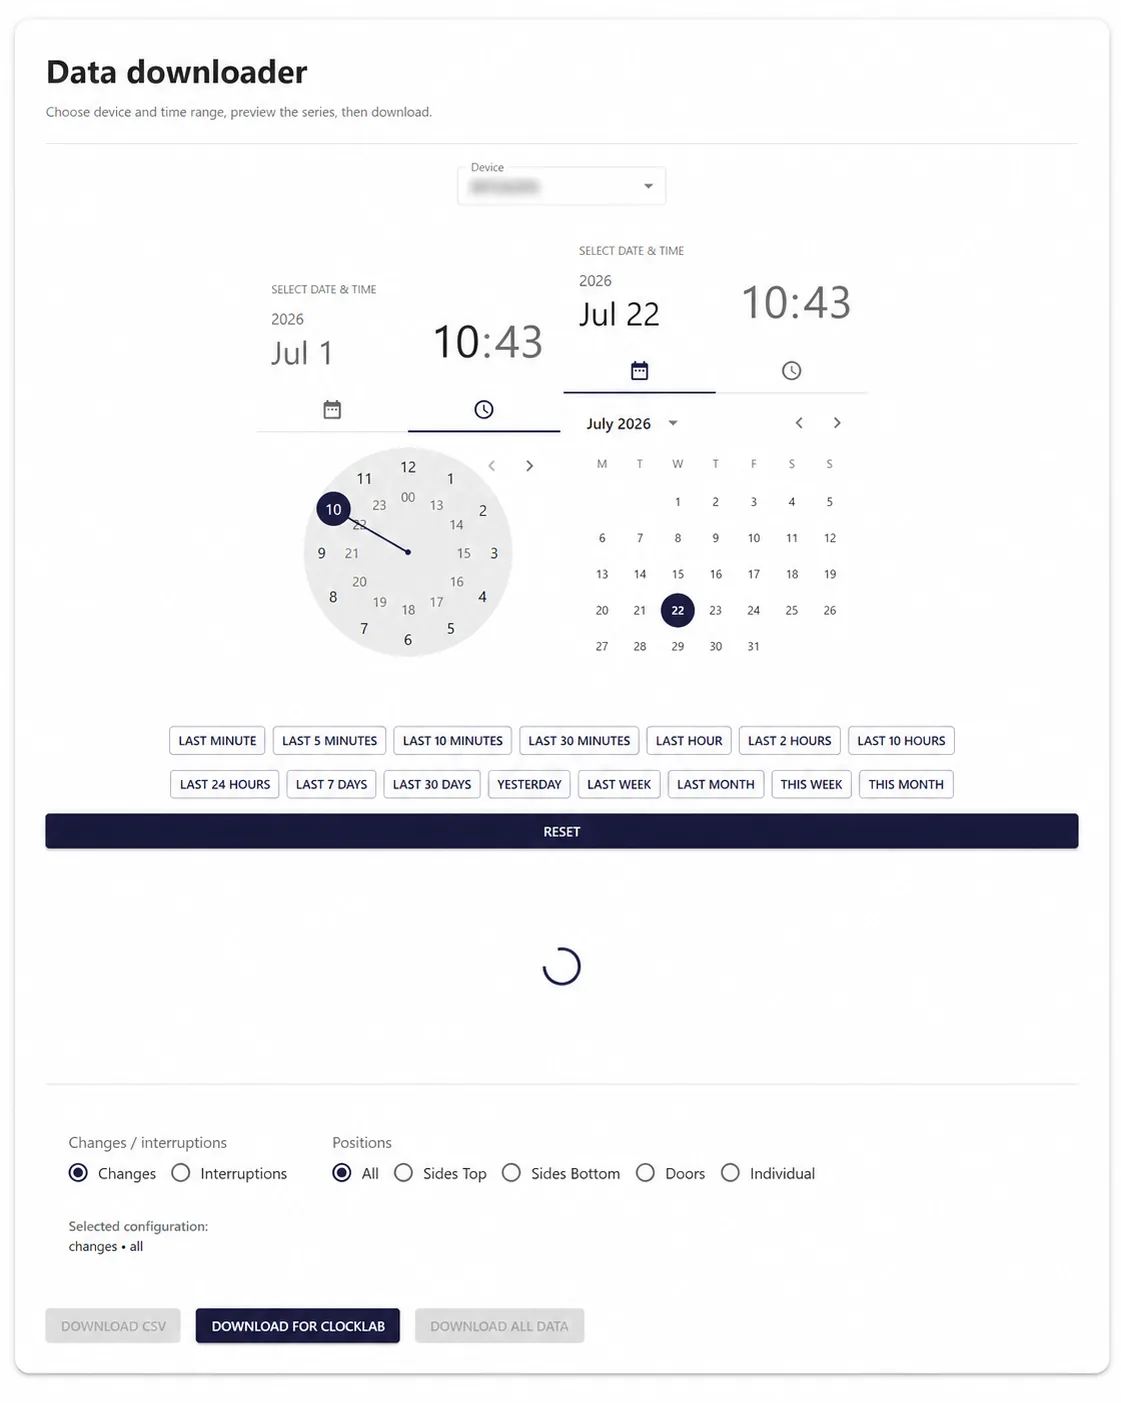
Flexible data export
Choose a device, exact time range, metric and sensor group, preview the selection and export the result for further analysis.
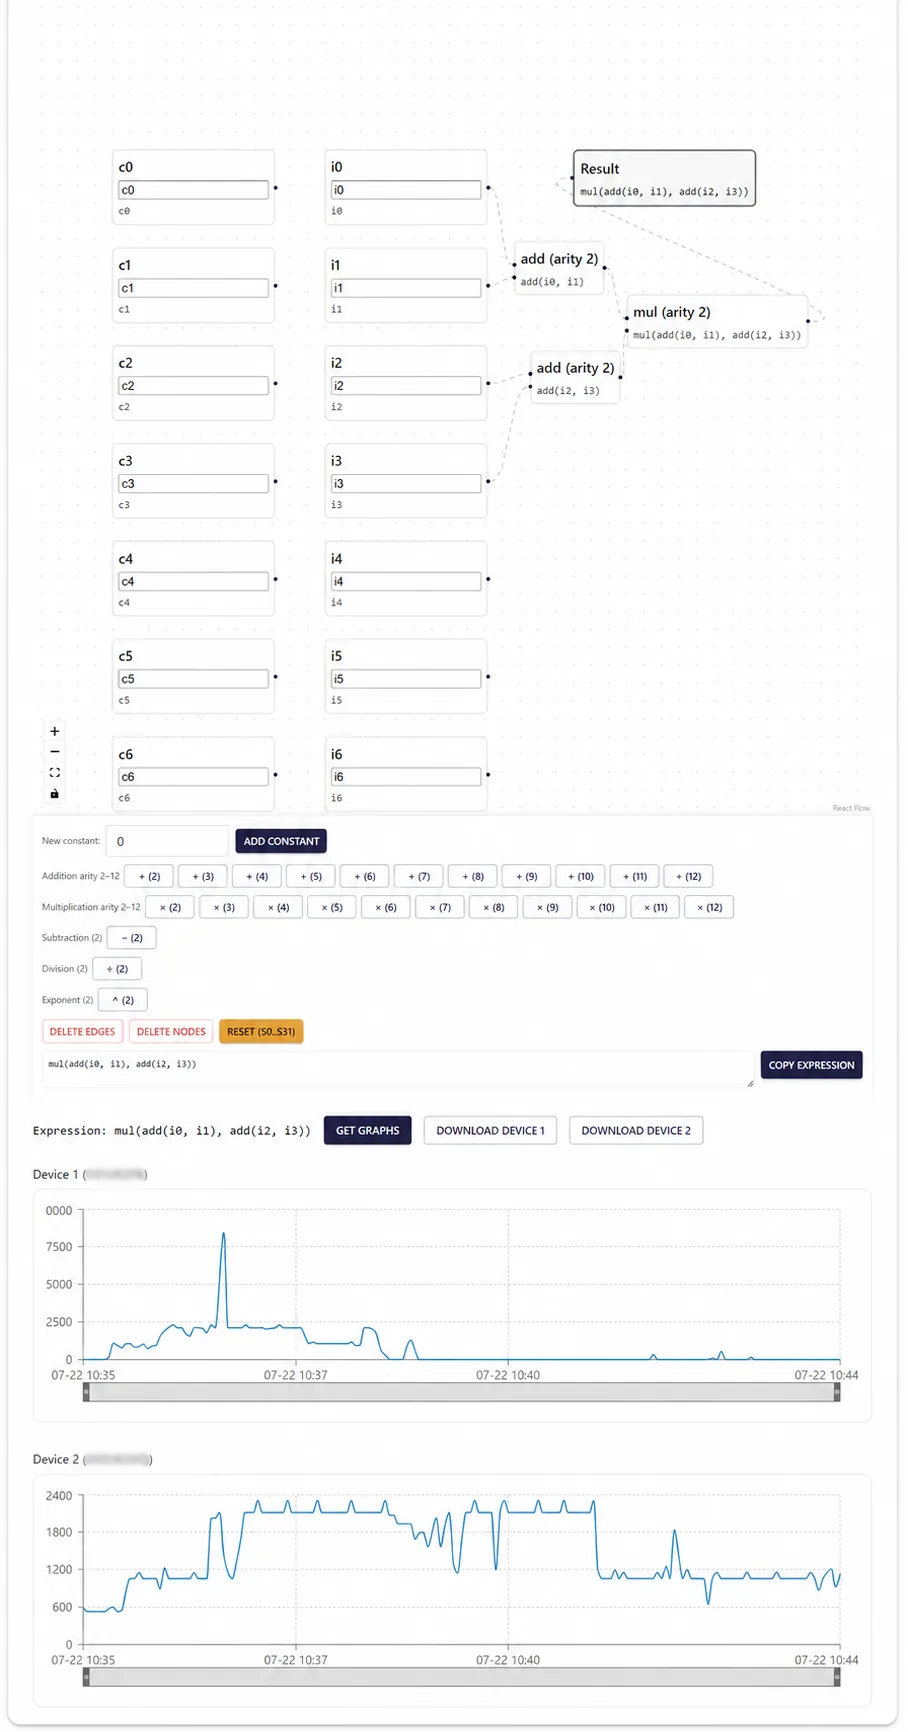
Visual flow editor
Create derived metrics by connecting change and interruption channels in a visual graph. Preview calculated series immediately and download results without modifying device firmware.
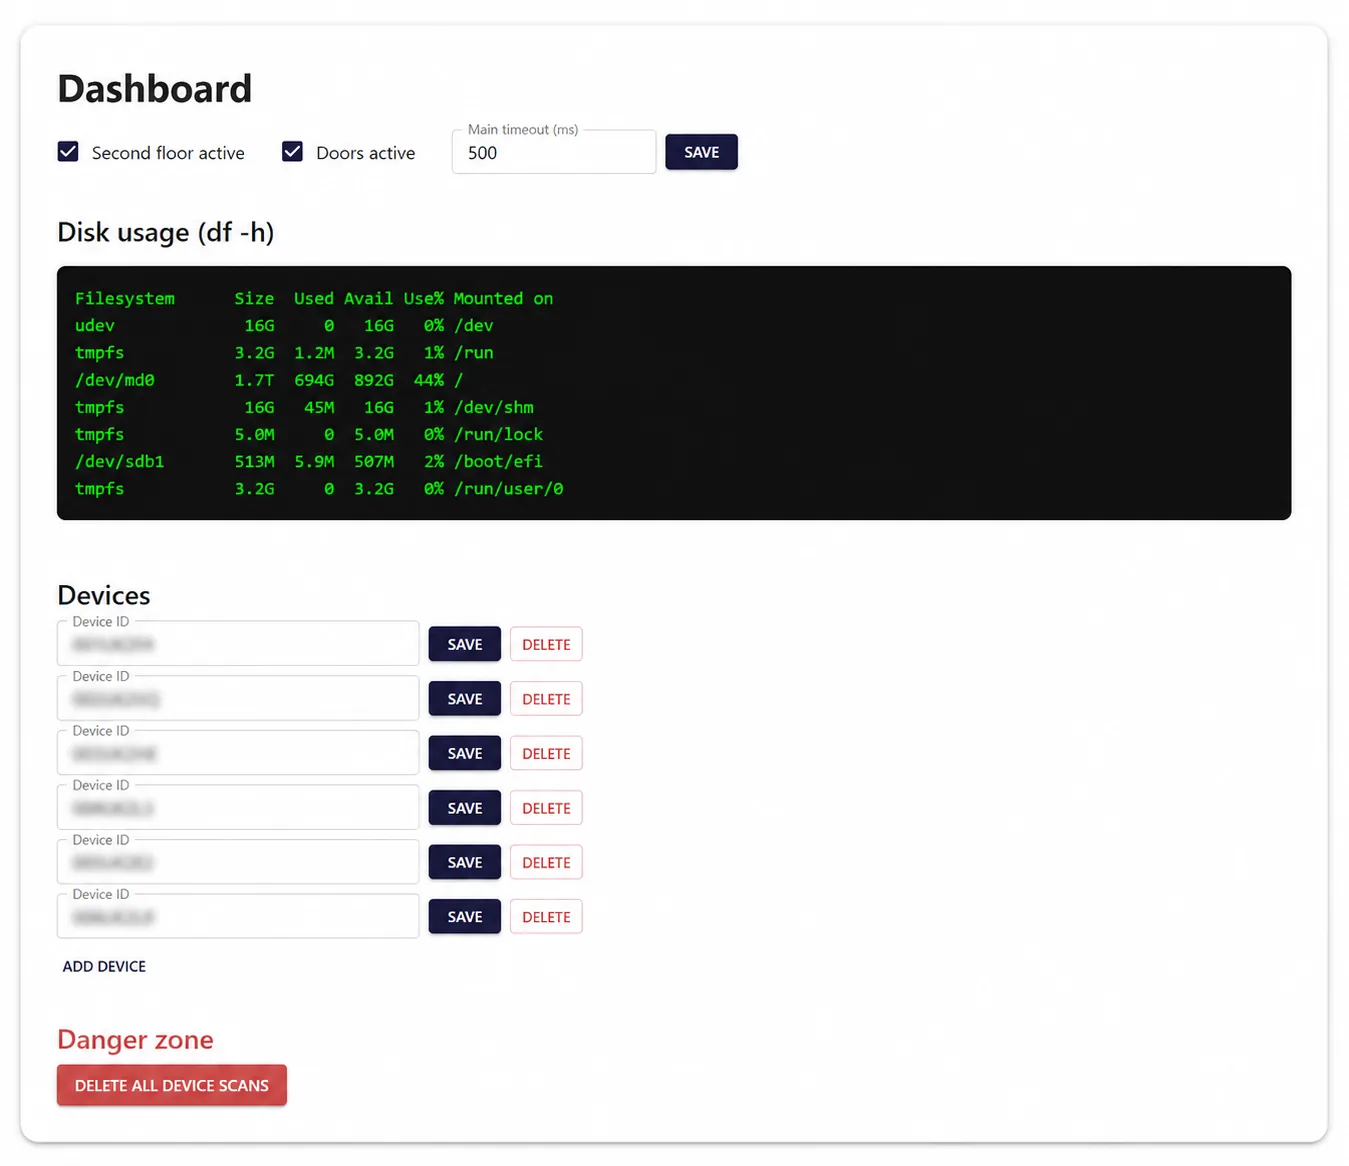
System dashboard
Manage connected devices, measurement levels, door sensing and acquisition timing from one administrative screen. Storage information keeps long-running installations easy to supervise.
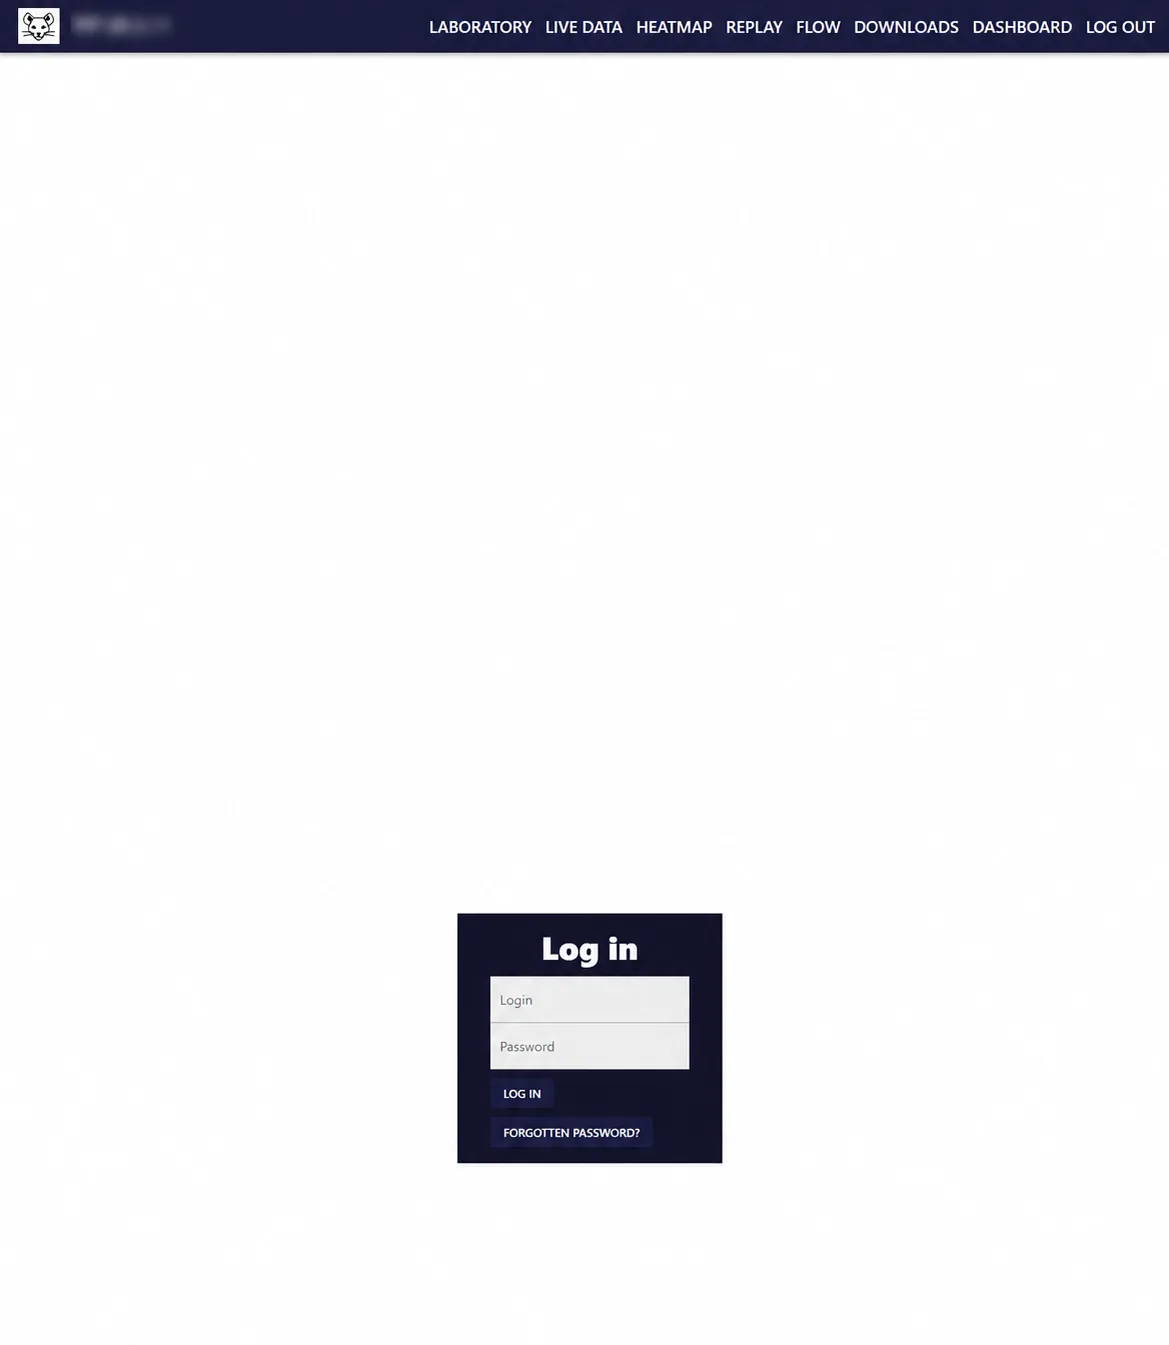
Controlled access
A straightforward sign-in screen protects administrative and experimental functions while keeping daily access quick for authorized laboratory staff.
Four measurement variants
Choose how much of the cage you want to observe.
Each of the four variants is available as either a large or a small frame. In every case, sensor height can be adjusted and sensor spacing starts at 2 cm.
3D
Multiple horizontal measuring levels plus the door area capture movement across the cage and between heights. This is the most complete configuration for spatial activity and direction analysis.
Best for: maximum spatial information and multi-level movement studies.
2D
A single horizontal measuring plane records movement across the selected cage level. It offers a clear activity map with simpler hardware and data than the full 3D version.
Best for: locomotion studies focused on one defined height.
No doors, two floors
Two horizontal measuring levels monitor activity at two independently chosen heights, while the door sensors are omitted. The result is richer vertical coverage without measuring entrances.
Best for: cages where two internal levels matter and doors do not.
No doors, one floor
One horizontal measuring level provides the most focused and economical arrangement. The sensors remain height-adjustable and their spacing starts at 2 cm.
Best for: straightforward activity monitoring at one cage level.
Request for quotation
Tell us what your experiment needs.
We will match the frame size, one of the four measurement variants and sensor height to your cage and intended study.
- Large or small device
- 3D, 2D, no-door two-floor or no-door one-floor
- Preferred measuring height and cage dimensions
- Number of devices and software workflow